|
All 5 books, Edward Tufte paperback $180
All 5 clothbound books, autographed by ET $280
Visual Display of Quantitative Information
Envisioning Information
Visual Explanations
Beautiful Evidence
Seeing With Fresh Eyes
catalog + shopping cart
|
Edward Tufte e-books Immediate download to any computer: Visual and Statistical Thinking $5
The Cognitive Style of Powerpoint $5
Seeing Around + Feynman Diagrams $5
Data Analysis for Politics and Policy $9
catalog + shopping cart
New ET Book
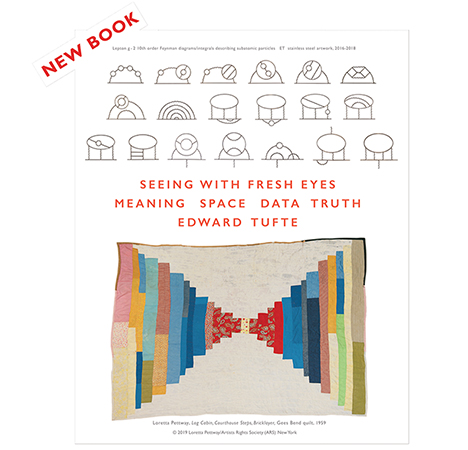
Seeing with Fresh Eyes:
catalog + shopping cart
Meaning, Space, Data, Truth |
Analyzing/Presenting Data/Information All 5 books + 4-hour ET online video course, keyed to the 5 books. |
 |
One feature of note is the 'crows feet' at the right of a line to indicate that there is more than one data point on that line.
The printed article shows the 'fuzzy' lines as solid. It is obviously an artifact of the conversion to web format.
-- Andrew Nicholls (email)
This is an extraordinary example.
More to come, including a sparkline redesign next week.
-- Edward Tufte
Moving from a 1 Dimensional to a 2 Dimensional distribution "All Streets consists of 240 million individual road segments. No other features -- no outlines, cities, or types of terrain -- are marked, yet canyons and mountains emerge as the roads course around them, and sparser webs of road mark less populated areas. " http://fathom.info/allstreets/
-- Andrew Nicholls (email)
For context, this illustration is taken from Brian Hayes, The Spectrum of Riemannium, American Scientist, Volume 91, Number 4 (July-August, 2003), pages 296-300
-- James Scott-Brown (email)
|
||||||